ETFs
ETFs


Swing Trade with Bollinger Bands
What are Bollinger bands?
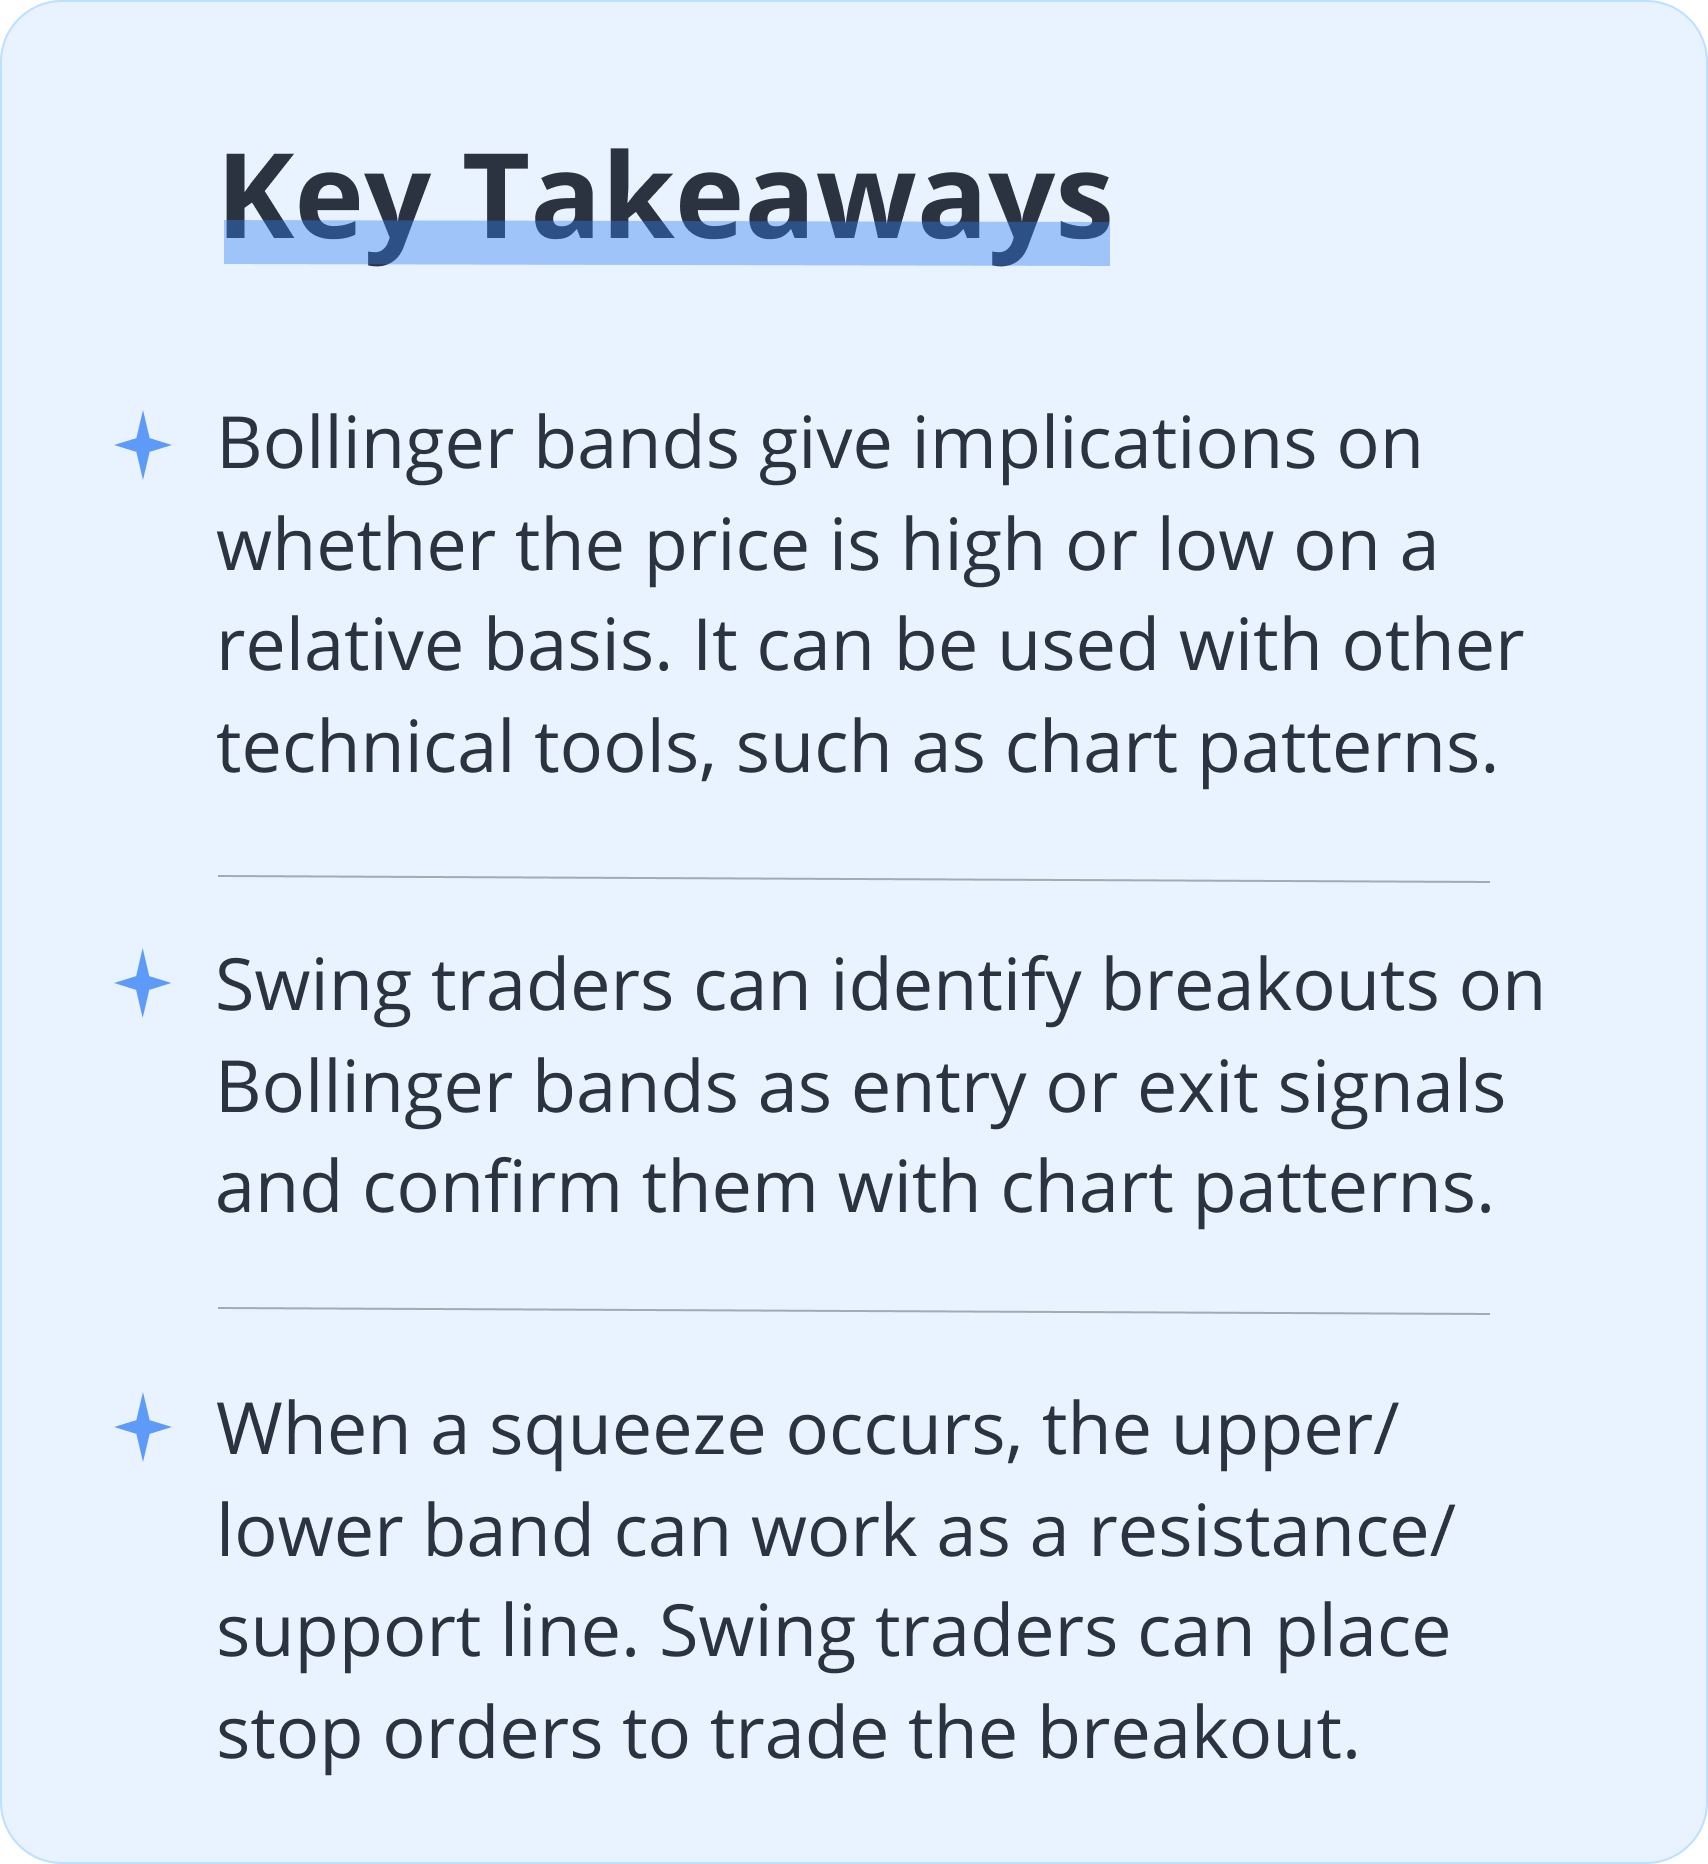
Bollinger bands consist of a middle band with two outer bands.The middle band is a simple moving average, usually a 20-d moving average, while the lower and upper bands are the 2 standard deviations.
Investors can customize the settings according to their needs. For example, if they’re looking for very short-term trading opportunities that last only a few days, they may set the standard deviation below 2, for example, 1.5.
Generally speaking, Bollinger bands tell us three things.
- The wider the distance between the bands, the higher the volatility.
- When the price moves closer to the upper band, the asset is overbought. When the price moves closer to the lower band, the asset is oversold.
- Prices breaking through the upper or lower band can be reversal signals.
Trading breakouts
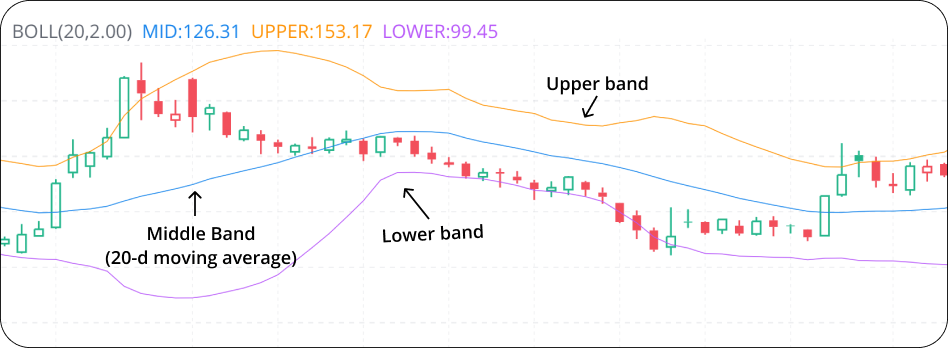
The stock/ETF is overpriced when it’s in the upper band and it is underpriced when it’s in the lower band. Swing traders may choose to buy when the price drops below the lower band and sell when the price rises to break through the upper band. This strategy is typically more effective when the price is moving in a range, as shown below.
Cautious swing traders may wait to trade the breakout until it’s confirmed by a candlestick or chart pattern. Let’s look at two examples.
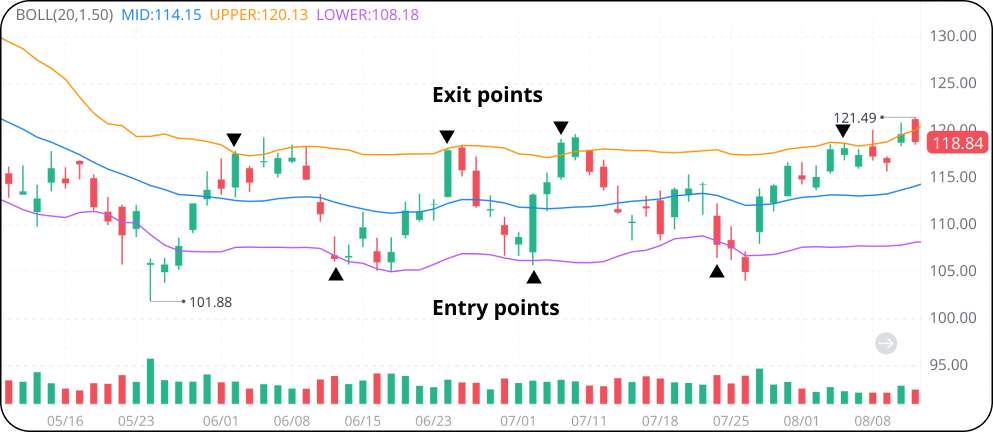
Bullish crossover confirmed by bullish engulfing pattern
As we can see below, the price broke through the lower band with a long bullish candle, engulfing the previous bearish candle completely. Following the breakout and the bullish engulfing pattern, the price went for a big jump.
Swing traders may enter a long position after the breakout and exit when the price touches the upper band.
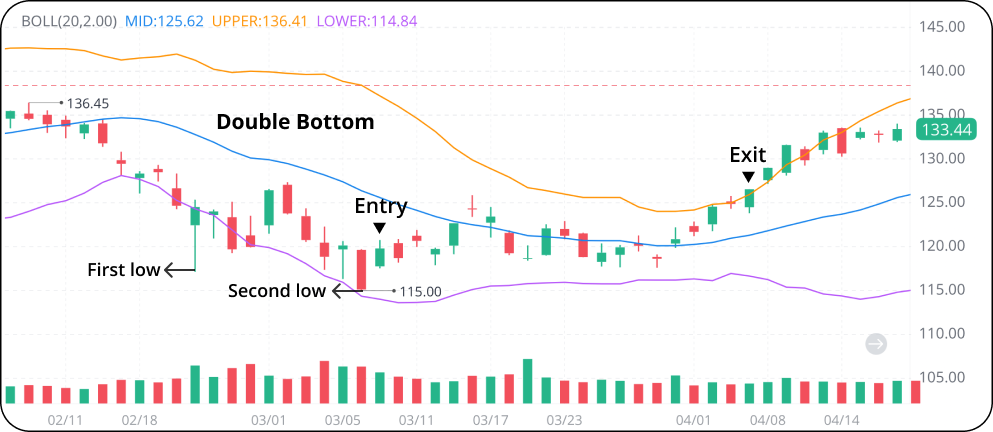
Bullish crossover confirmed by double bottom
The price closed below the lower band for a few days, making a first low at around $117. It then bounced a bit and fell again, reaching a second low inside the lower band and rose again, forming a double bottom on the chart, signaling an uptrend.
Swing traders may enter a long position following the second low and close the position when the price breaks through the upper band. They may also wait for the price to fall back to the middle band before making an exit.
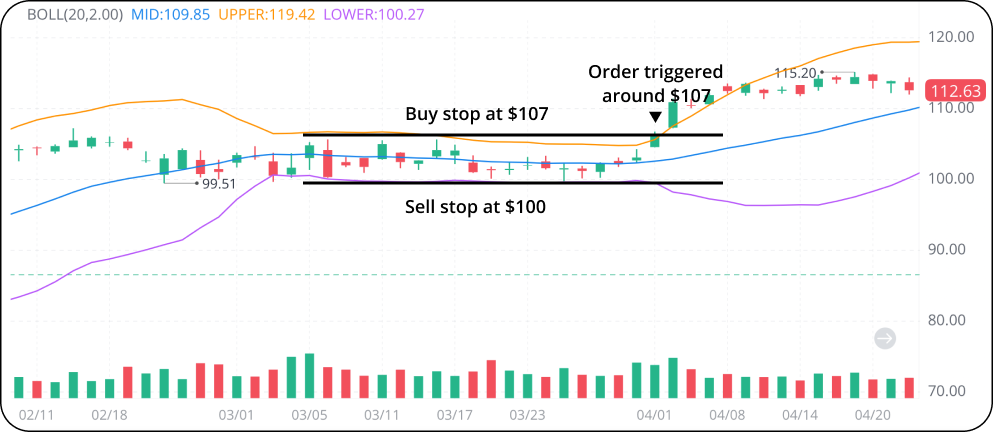
Trading the squeeze
When the upper and lower bands move close together, a squeeze occurs. A squeeze represents low volatility. The price will typically move substantially following the squeeze.

During a squeeze, the upper band can be seen as a resistance line and the lower band as a support line. Investors could either enter a long position when the price breaks through the upper band or enter a short position when the price breaks through the lower band to trade the squeeze.
They can enter a buy stop order above the upper band or sell stop order below the lower band to monitor the market.
The Bottom Line
Swing traders can identify entry or exit points quickly by using Bollinger bands. However, it can be risky if used as a standalone indicator. Swing traders should use Bollinger bands together with other technical tools, such as chart patterns or MACD.
Which technical signal do you usually use together with Bollinger bands? Leave a comment below!