US Stocks
 US Options
 ETFs
ETFs Emerging Asia
 GBP Cash Savings
 Charts & Tools
 Paper Trading
 Extended Hours
 Wall Street Journal
 TradingView
Swing Trade with MA
What is MA?
Moving average (MA) is a technical ind icator frequently used by investors. An MA is the average of the closing prices of a security over a specified period. For example, a 5-day MA is calculated as the average of the closing prices over the last five trading days. Investors can customize the length according to their investment horizons.
MA helps to provide a clear picture of market trends and identify possible price reversals.
1. The stock is in an uptrend if it’s above the MA. It is in a downtrend if the price is below the MA.
2. A bullish crossover is formed when a short-term MA moves upwards to cross the longer-term MA, indicating an upcoming uptrend; A bearish crossover is formed when a short-term MA drops beneath the longer-term MA, indicating an upcoming downtrend.
If you’ve never used it on your chart, you’d probably ask what the difference is between SMA and EMA.
Simply put, the exponential moving average (EMA) moves faster and changes direction earlier than the simple moving average (SMA or MA). This means that EMA reacts faster when price change takes place, but meanwhile, it could give false signals too early.
Use Screener to find candidate stocks with MA
If you’ve not created a watchlist yet, you can find stocks that are trending up/down or are likely to have a price reversal soon by applying MA in the Screener.
You can select ‘Long Trend’ to see stocks whose price is above the 5-day MA and 10-day MA. If you’re looking for stocks with a recent bullish crossover, select “Long Crossover” to see stocks whose 5-day MA recently rises above 10-day MA.
Or, you can customize the MA screener by applying different periods, for example, a 20-day MA and a 50-day MA.
Finding an entry with MA
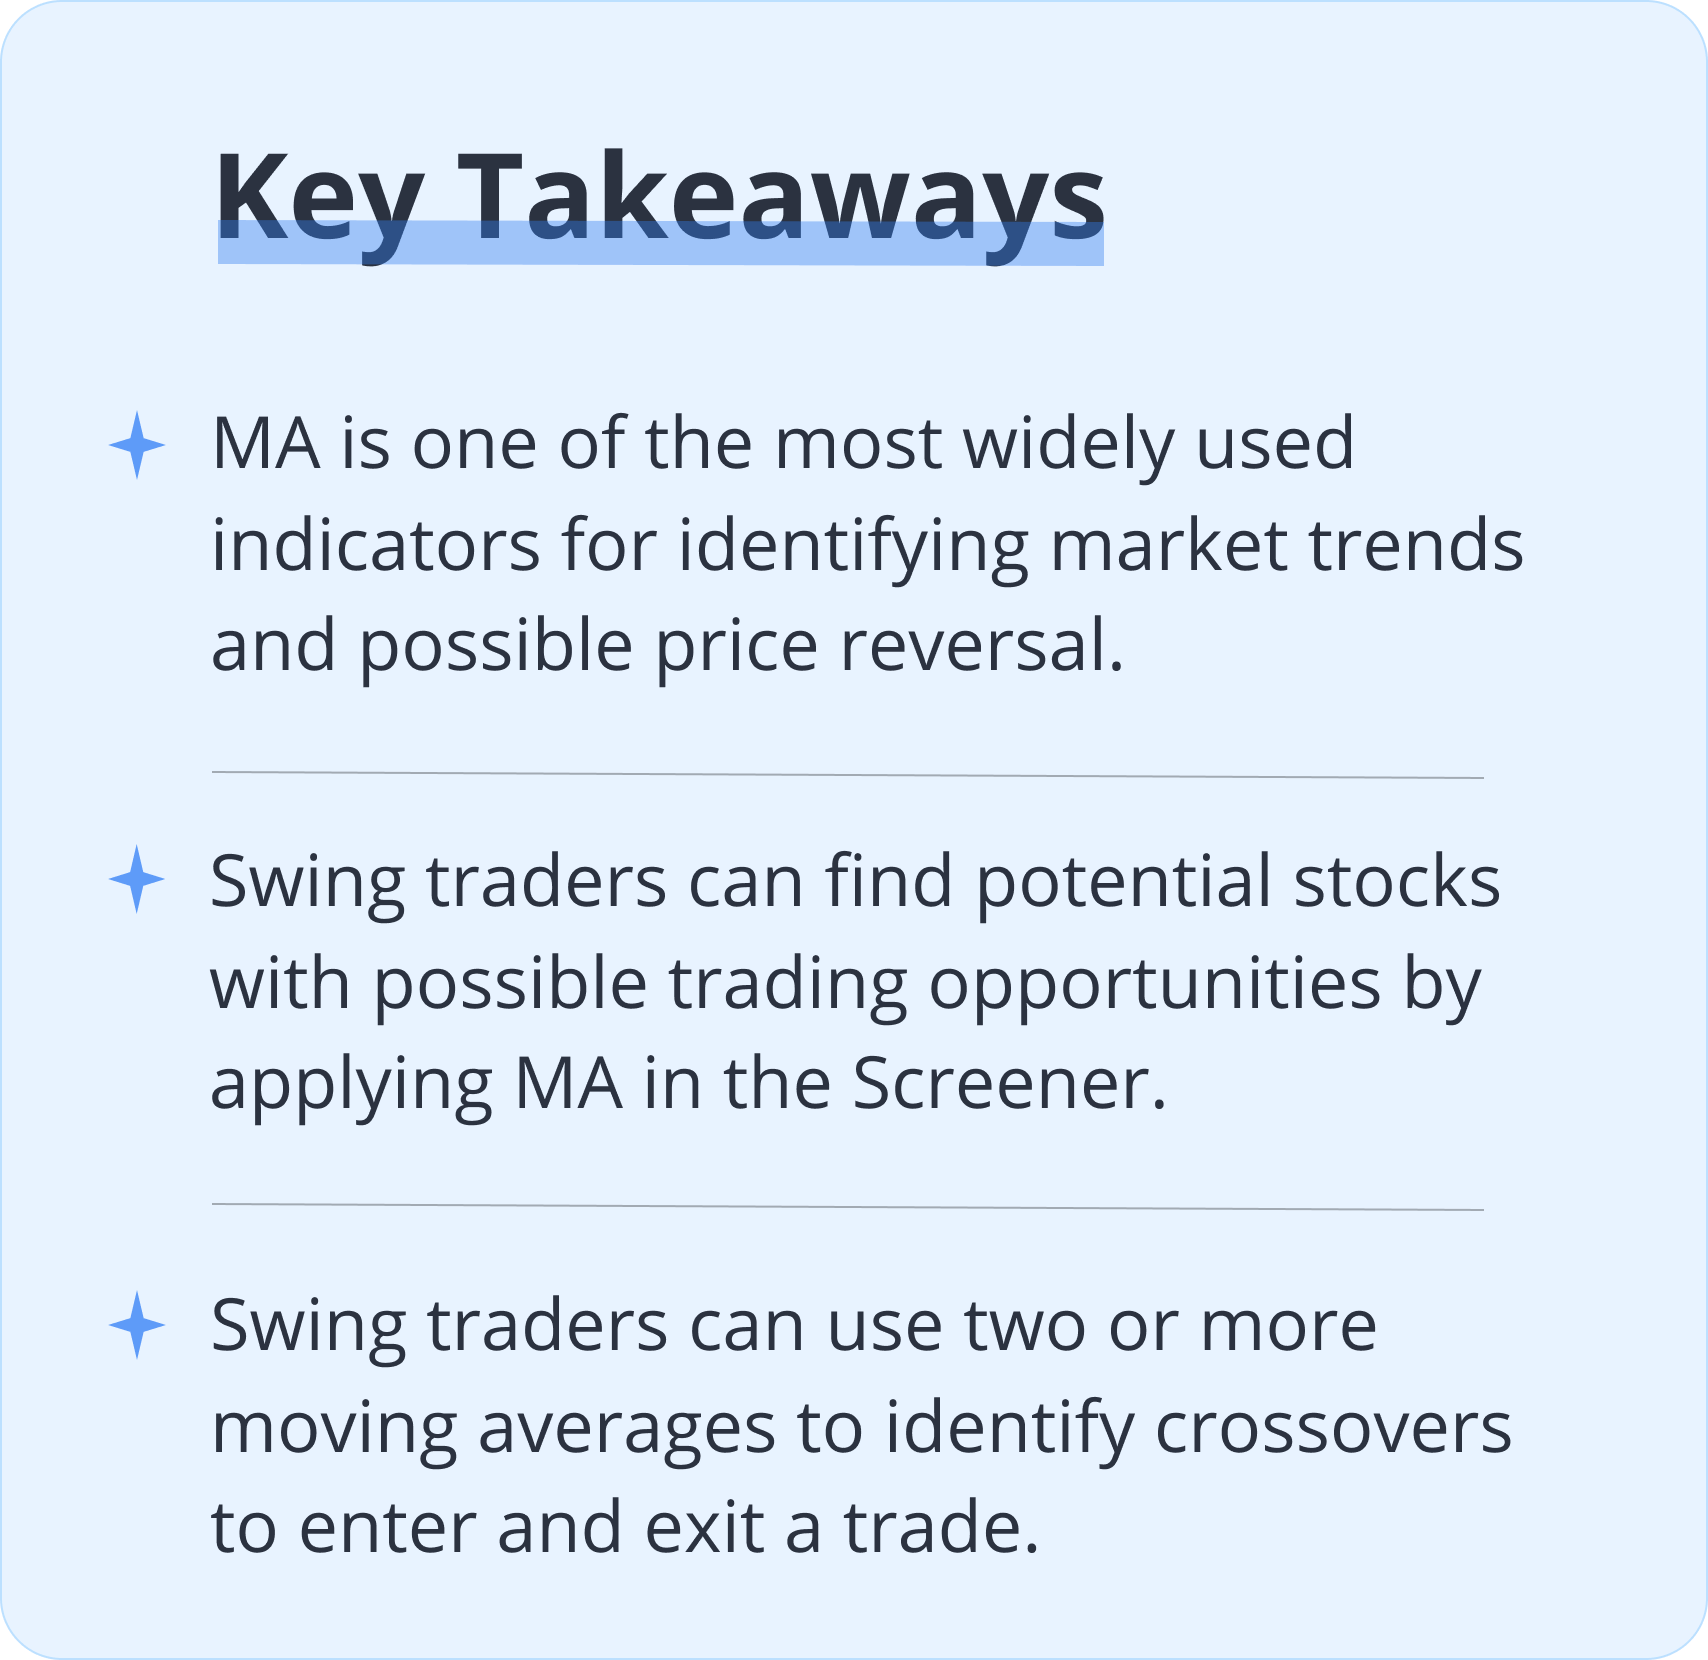
Investors can use two or more moving averages to identify crossovers.
Some of the most frequently applied periods for swing traders include 5-day, 10-day, and 20-day. However, investors may customize the period according to their investing preferences. Some people would prefer a shorter period, such as a 3-day MA, while some may choose a longer period, such as a 50-day MA.
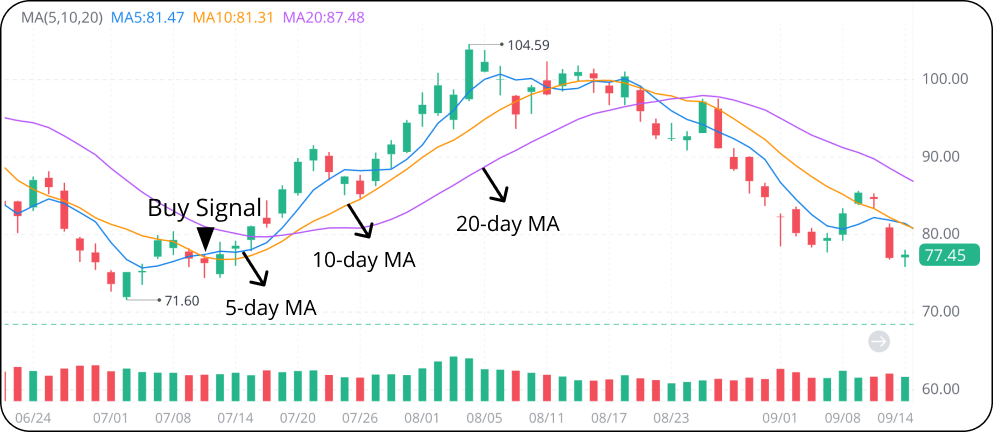
In the example below, we’ll illustrate how to find an entry with the 5-day and 10-day MA.
A buy signal may be confirmed when the 5-day MA rises above the 10-day MA. To make sure the uptrend does not reverse immediately, investors can wait until both 5-day MA and 10-day MA rises above the 20-day MA to enter a trade.
Technically speaking, the wider the moving averages separate following the crossover, the stronger the signal is. If the shorter-term MA just drifts over the longer-term MA, the signal can be weak. If you want an early entry, be sure to watch the momentum of the trend. (Click here to learn about the momentum indicator, RSI)
Finding an exit with MA
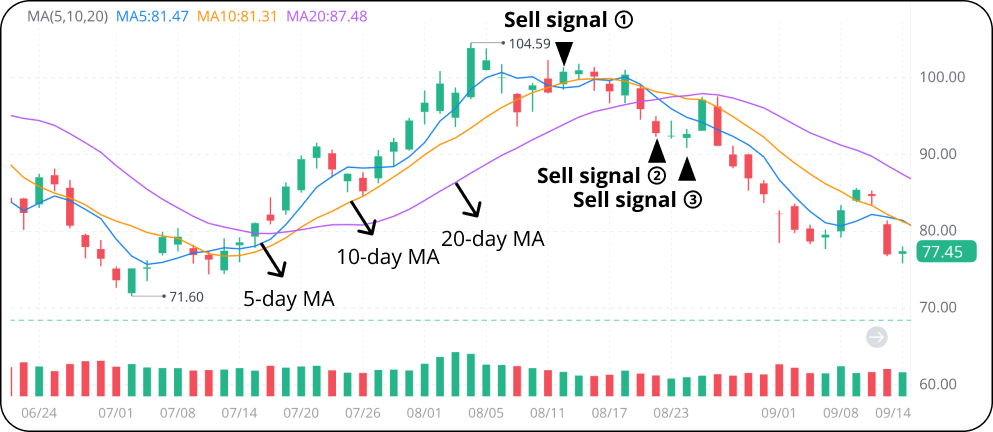
Investors could plan an exit when the trend loses momentum.
Continuing the example above, the uptrend starts to lose momentum when the distance between the 5-day and 10-day MA narrows. Swing traders could exit the trade at Sell signal 1 when the 5-day MA crosses back below the 10-day MA. Or, they can exit at Sell signal 2 when the 5-day MA drops below the 20-day MA as well. A strong sell signal is formed when both 5-day MA and 10-day MA move back below the 20-day MA (Sell signal 3). Swing traders should close their long position immediately upon seeing this signal.
The Bottom Line
MA can be a helpful indicator for identifying trends and price reversals if used appropriately. Swing traders can identify entry and exit points by using this indicator. However, they should bear in mind that no indicator is 100% accurate. It’s safer to confirm the MA trading signals with other indicators such as the RSI.
Which MA do you use most for swing trading? Leave a comment here!